Help for OncotRF database
1. Overview of OncotRF Database
Transfer RNA-derived RNA fragments (tRFs) is a novel class of small non-coding RNAs that are abundant in many organisms. Emerging evidence indicates that tRFs exert much funtional regulation in gene expression. In our study, we developed a new computional workflow for de novo tRFs mining from small RNA-seq and depicted a functional genomic landscape of tRFs in 11,211 specimens across 32 cancer types from TCGA (Figure 1).
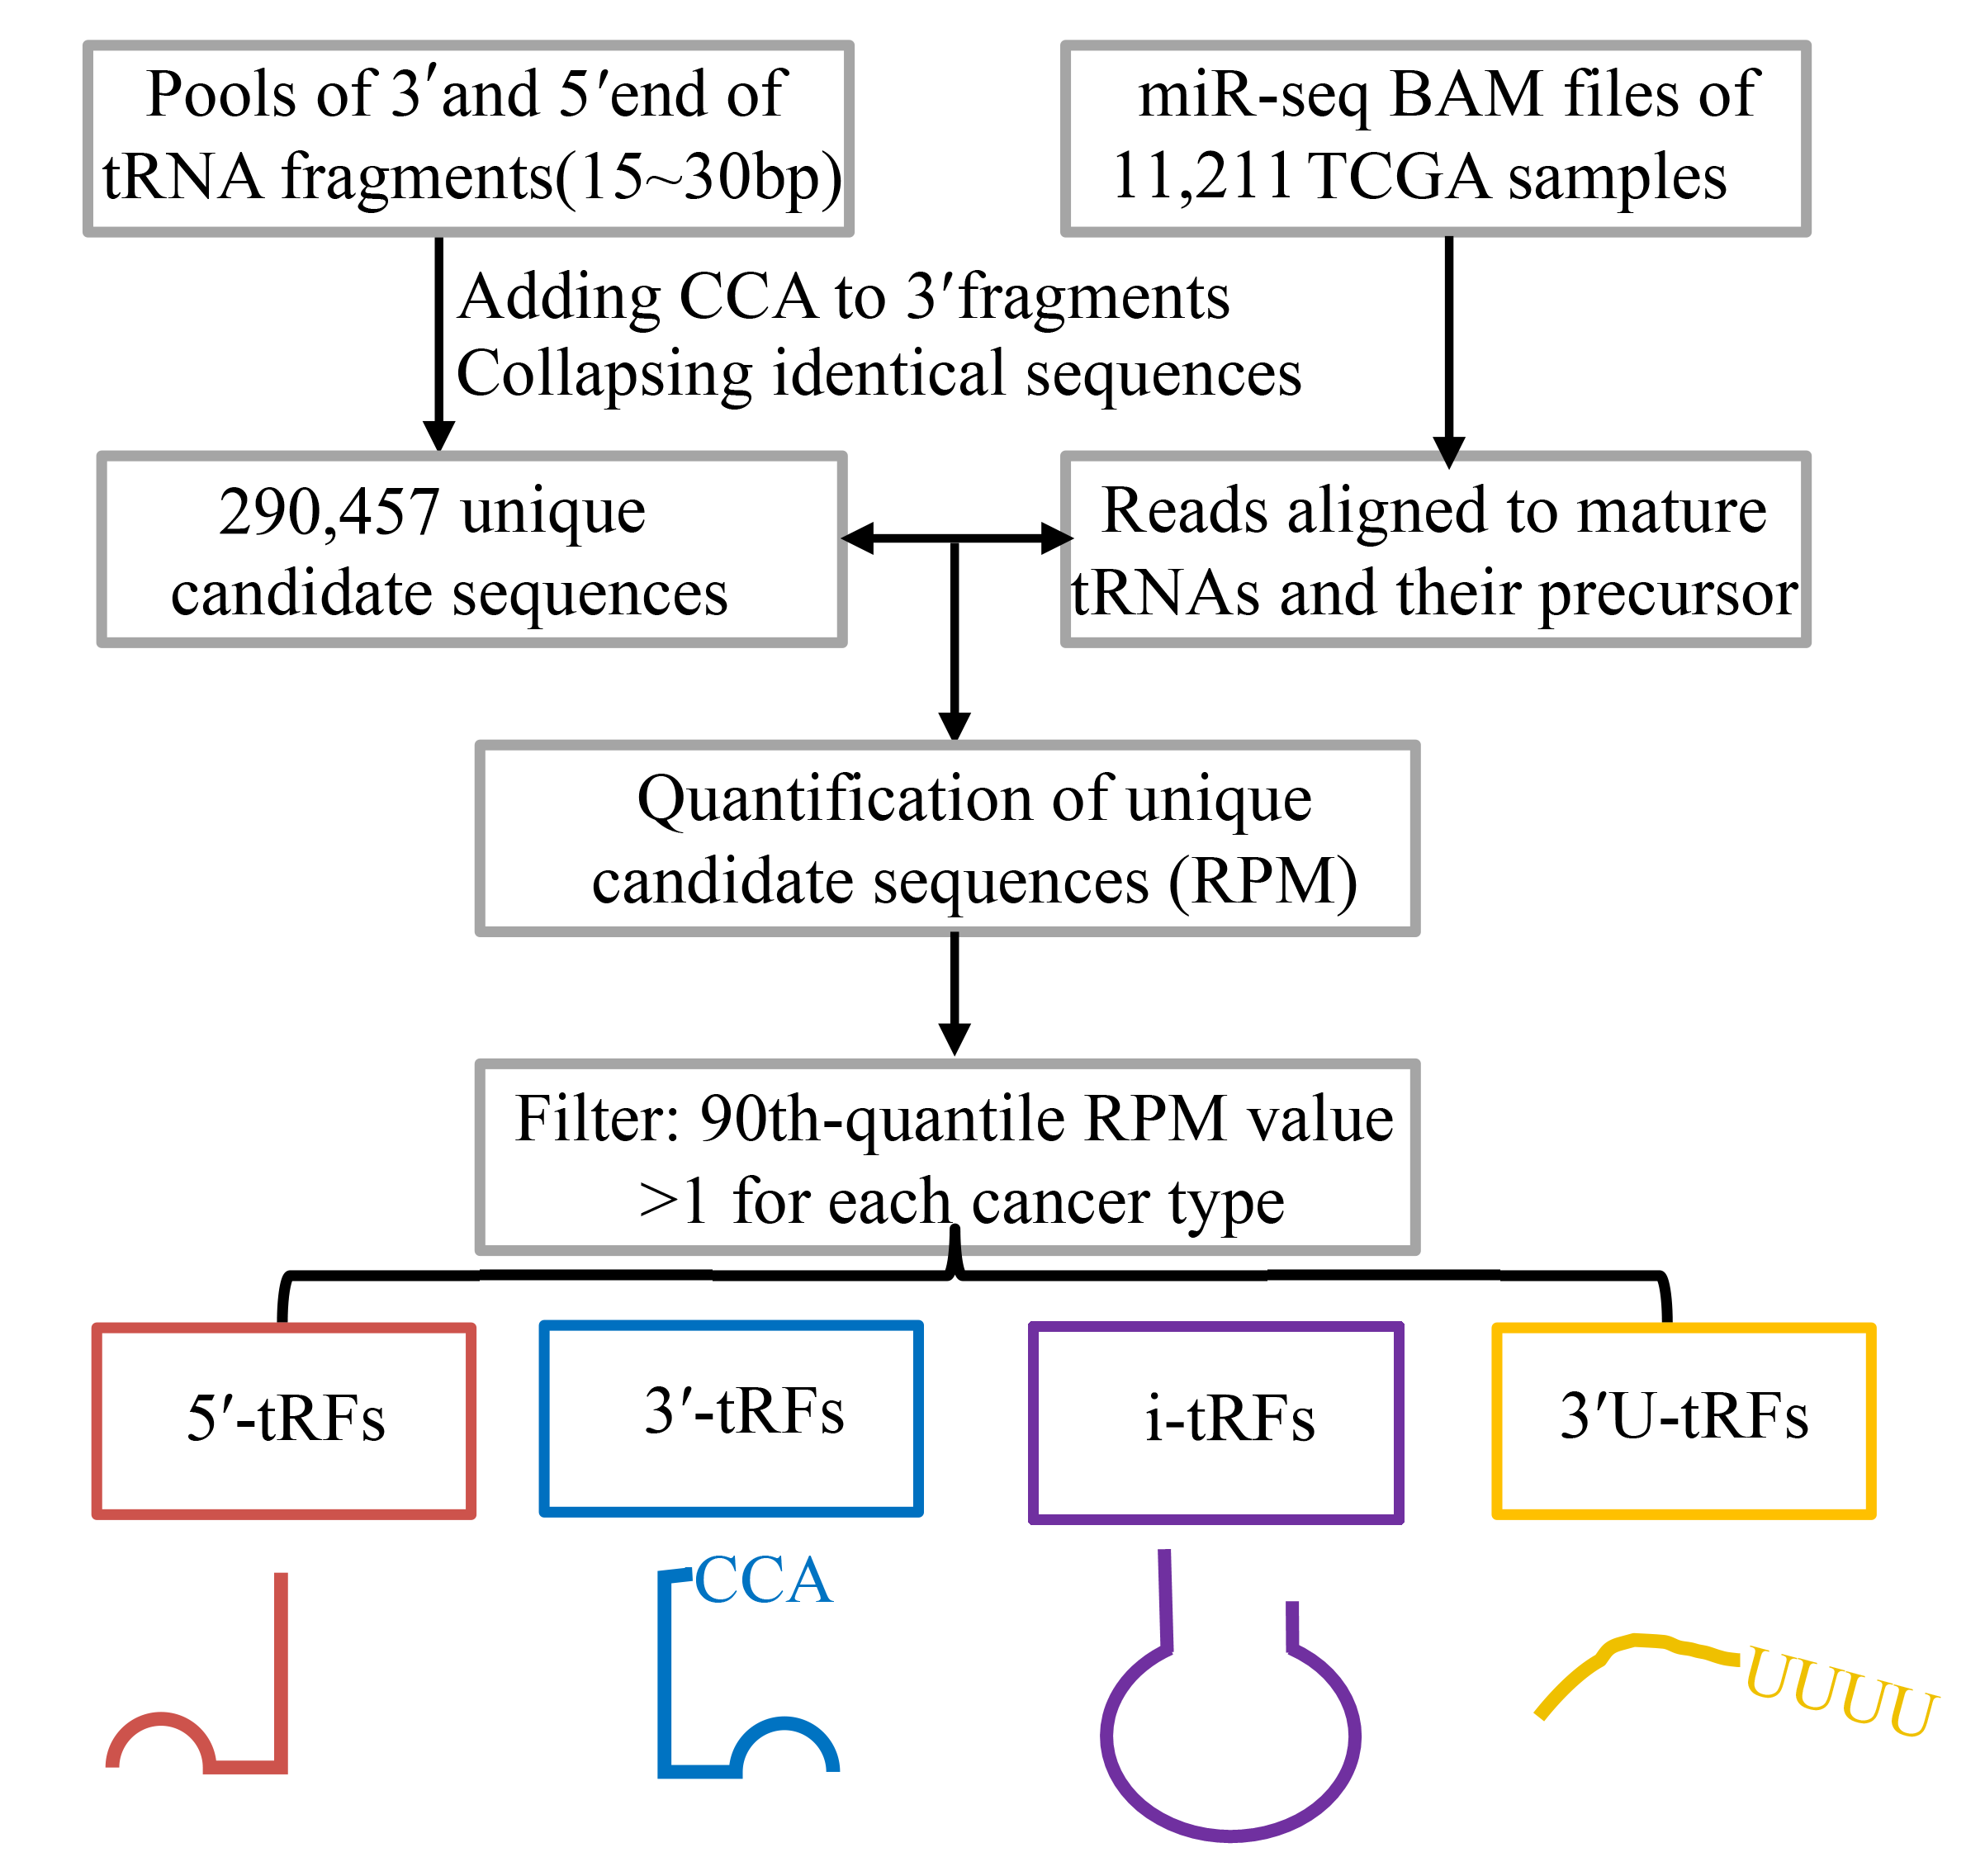
Figure 1: Workflow for de novo tRFs mining from small RNA-seq
a) Data collection
The BAM files of small RNA sequencing datasets were downloaded from the Cancer Genomics Hub (https://cghub.ucsc.edu).
The mRNA expression profiles and the corresponding patient clinical information, including survival time, age, tumor stage, and tumor grade were downloaded from the International Cancer Genome Consortium (ICGC) Data Portal (http://dcc.icgc.org).
The sequences of 610 nuclear tRNA genes in humans were downloaded from GtRNAdb (
http://gtrnadb.ucsc.edu).
The sequences and genome loci of 22 mitochondrial tRNA genes were downloaded from NCBI (
https://www.ncbi.nlm.nih.gov/nuccore/251831106) and named as "mito-tRNA-Amino acid abbreviations-codon”. For example, “mito-tRNA-Val-TAC” indicates mitochondrially encoded tRNA valine (Val) with codon “TAC”. tRNA modification information was retrieved from MODOMICS database (
http://modomics.genesilico.pl/). MODOMICS manually curated tRNAs with experimentally mapped modified nucleosides.
b) tRF identification
"CCA" was added to the 3'end of mature tRNA sequences. Then we mapped the reads of smalll RNA sequencing data to CCA-tRNA and pre-tRNA and calculated the expression of tRFs as RPM. To obtain robust tRFs, we filtered out the tRFs with 90th quantile RPM < 1 and those remaining were named as detectable tRFs for each cancer type. Furthermore, the expression of tRFs was log2-transformed and then upper-quantile normalized across samples before being used for downstream analysis.
c) Nomenclature of tRFs
Each tRFs starts with a unique class identifier (i.e., 3'-U-tRFs start with 3'-U-, 5’-tRFs start with 5’-, 3’-tRFs start with 3’- and i-tRFs start with i-). If the tRFs can be derived from more than one tRNA gene, an identifier "-M" will be assigned next to the class identifier. The next identifier is the nuclear tRNA id from GtRNAdb (e.g. tRNA-Ala-AGC-3-1) or mitochondrial tRNA id we named as described above (e.g. mito-tRNA-Val-TAC). The next identifier is the length of tRF sequence, such as "L16" means the tRF is 16 nucleotides in length. For i-tRFs, there is a more identifier that indicates the position of the first nucleotide on the source tRNA.
As shown in Figure 2, each line represents a type of tRFs. First column represents tRFs only can be derived from one mature tRNA or pre-tRNA. Second column represents tRFs can be derived from at least two mature tRNA or pre-tRNA.
(1) The first line represents two examples of 3'U-tRFs. They start with "3'U" in red. The first tRF "3'U-mito-tRNA-Val-TAC_L22" can only be derived from precursor sequence of tRNA "mito-tRNA-Val-TAC" (purple) that is a mitochondiral tRNA gene. The tRF sequence length is 22 nucleotides (black). The second one can be derived from at least two tRNA genes and one of these tRNAs (indicated by 'M-' in green) is "tRNA-Gln-CTG-3-2" (purple). This tRF is 23 nucleotides in length (black).
(2) The second line were two tRFs of 3'-tRF type. "3'-tRNA-Ala-AGC-1-1_L19" is a 3'-tRF of 19nt ('L19' in black) which can only be derived from tRNA "tRNA-Ala-AGC-1-1" (purple). The second tRF "3'-M-tRNA-Gly-GCC-2-6_L22" can be derived from the 3' end of six mature tRNAs (CCA-tRNAs) (Figure 3), therefore it was assigned an identifier "M-" (green) next to the tRF type identifier "3'-" (red). "tRNA-Gly-GCC-2-6" is the tRNA id of one of the six source tRNAs. The last identifier "L22" indicates the length of the tRF is 22 nucleotides.
(3) The two tRFs in the third line are 5'-tRFs. The first one ("5'-tRNA-Ala-AGC-11-1_L19") is a 5'-tRF and can only be generated from the 5' end (5'- in red) of mature tRNA "tRNA-Ala-AGC-11-1" (purple). "L19" means the length of the tRF is 19nt.
(4) The two i-tRFs in the last line have an additional identifier "pos*" for i-tRFs. "i-tRNA-Ala-AGC-1-1_L21_pos54" is an 21 nt i-tRF that can only be derived from the body of tRNA "tRNA-Ala-AGC-1-1" and its first nucleotide is the 54th nucleotide (gold) on the mature tRNA sequence that was added with "CCA" to the 3'end. "i-M-tRNA-Ala-AGC-1-1_L17_pos58" is 17nt and can be derived from not only "tRNA-Ala-AGC-1-1" but also "tRNA-Asp-ATC-chr6-103". Its first nucleotide is the 58th nucleotide (gold) on the CCA-tRNA of "tRNA-Ala-AGC-1-1".

Figure 2. Nomenclature
2. Key Features
OncotRF now includes the following resources: 1) tRFs informations including tRF type, genome loci, sequence, modifications, validation information and etc.; 2) tRF expression across different cancers; 3) aberrant expressed tRFs, related abnormally expressed genes, network, their possible functions in each cancers, and survival analysis result; 4) customized differential expression analysis; 5) KM-plotter; 6) JBrowse.
1. OncotRF collected 11,211 small RNA-seq samples, 8,776 RNA-seq samples from TCGA and their corresponding clinical data across 32 cancer types.
2. OncotRF provides a total of 6966 tRFs with high-confidence across 32 cancers. All these tRFs information including sequence, source tRNAs, position on tRNAs, genome loucs, and expression in cancers, modifications, validations can be displayed in 'Search' result.
3. OncotRF provides "Cancers" function. Users can analysis of cancer related tRFs in each cancer.
To elucidate the underlying mechanism, we also provide differential expression genes from RNA-seq and calculated correlation coefficient between these tRFs and genes. This related tRF-genes pairs were orgnized as a visualized network. Enrichment of functions were also conducted and 7 enrichments results were provided including KEGG, Reactome, BioCyc, PANTHER, OMIM, KEGG Disease and GO.
4. OncotRF provides "Custom" function. Users can choose two groups of samples and submitted to the server. Then details of the two groups and differential expression tRFs between this two groups will be displayed for users.
5. OncotRF provides "KM-plotter" function. The survival curve of overall survival (os), disease-free survival (dfs) and relapse-free survival (rfs) of a specified tRF will be plotted using Kaplan-Meier method.
6. OncotRF provides genomic annotation of tRFs, tRNAs and genes with JBrowse.
3. Search function
OncotRF provides an easily searchable interface and allows users to input a tRF ID, tRF type, tRF sequence, source tRNA name, anti-codon, genome region, or aliases from literature. Taking "3’-M-tRNA-Gly-GCC-2-6_L22" (Figure 3, red box) as an example.

Figure 3. Search of 3’-M-tRNA-Gly-GCC-2-6_L22
As shown in Figure 4, a detailed page including tRF ID, tRF type, source tRNA, genome loci (hg19), tRF length, sequence, and links to the three additional pages ("Expression", "Alignment & Modification", and "Validation" pages) will be displayed. Users can sort each column by click up and down arrow (red box) besides the column name or filter the result by input anything in the search textbox (green box). The result page provides links to other detailed information page. Source tRNA can be link to
GtRNAdb (nuclear tRNAs) or
NCBI (mitochondrial tRNAs).
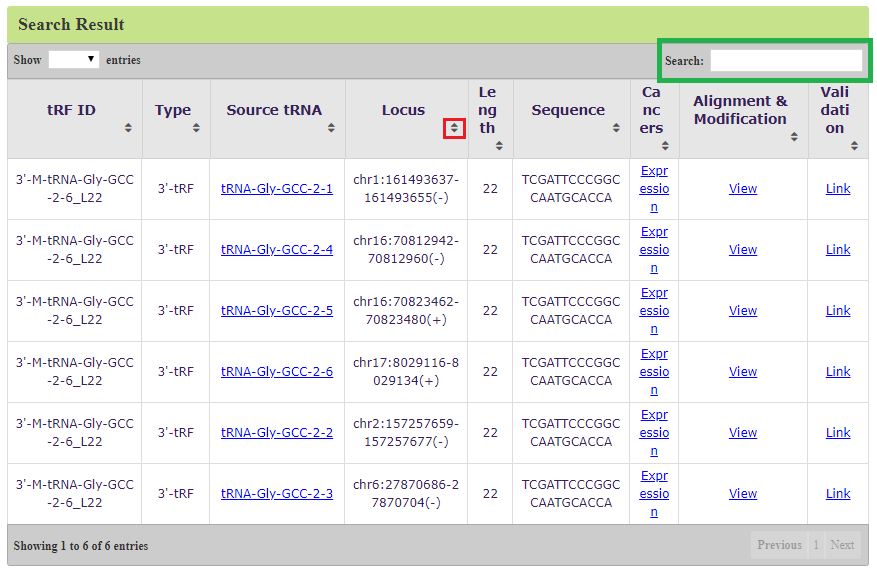
Figure 4. Search result of 3’-M-tRNA-Gly-GCC-2-6_L22
In another case, if a tRF sequence can be also mapped to other genome loci (non-tRNA space), the chromosome and region will also be provided. For example, “5'-tRNA-Ala-AGC-6-1_L24” can be derived from tRNA “tRNA-Ala-AGC-6-1” (tRF: chr6:28779897-28779920(-)), but also can be mapped to the region on chromosome 10 (chr10:125664644-125664667(-)) (red box). In this case, we will display a warning on the top of the table, e.g. "Note: tRF IDs in bold red indicate that these candidate tRFs may be derived from tRNA, but can also be mapped to other non-tRNA loci. These tRFs may not be true tRFs.". These tRF IDs will also be shown in red bold (Figure 5).
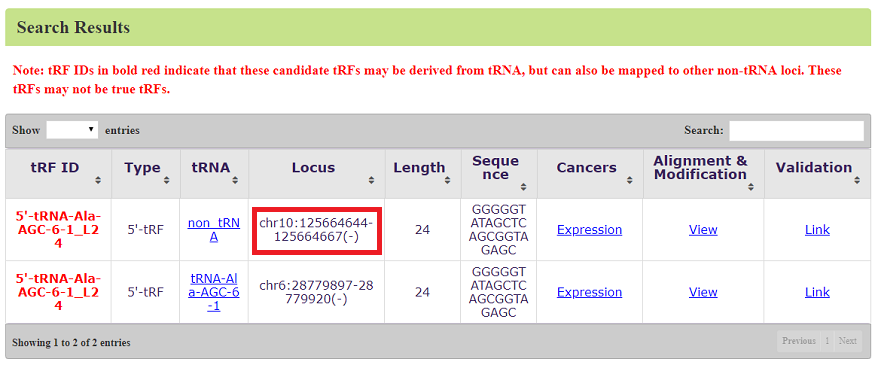
Figure 5: Search result of 5'-tRNA-Ala-AGC-6-1_L24
"Expression" can link to a new page that displays the tRF expression in different cancers. This page displays a boxplot of the tRF expression in each cancer (Figure 6A) and an expression table in cancers (Figure 6B). The table includes eight columns: the median expression (RPM) of the tRF in tumor samples (“Median Expression of Tumor (RPM)”) and normal samples (“Median Expression of Normal (RPM)”), the number of tumor samples (“Tumor Samples (RPM>1)”) and normal samples (“Normal Samples (RPM>1)”) expressed this tRF (RPM>1), total number of tumor samples (“Total Tumor Samples”) and total number of normal samples (“Total Normal Samples”) and total number of samples (“Total Samples”) (Figure 6B).

Figure 6: Expression of 3’-M-tRNA-Gly-GCC-2-6_L22
"Alignment" page displays the tRF sequence alignment with its source tRNA sequence, tRF position on the secondary structure of tRNA (red nodes), and possible modificatiions on the source tRNA (Figure 7).

Figure 7: Alignment & Modification of 3’-M-tRNA-Gly-GCC-2-6_L22
"Validation" page displays all the reports retrived from PubMed that validated the function of the tRF in cancers.(Figure 8).

Figure 8: Validation of 3’-M-tRNA-Gly-GCC-2-6_L22
OncotRF also allows keyword search for tissue (e.g. "bladder") or cancer type (e.g. "bladder cancer") . For tissue or cancer type, we will return the links (Figure 9) to a) tRF expression in corresponding cancers (Figure 6); b) differential expressed tRFs, mRNAs and functional analysis (Figure 11); c) survival analysis results (Figure 15).
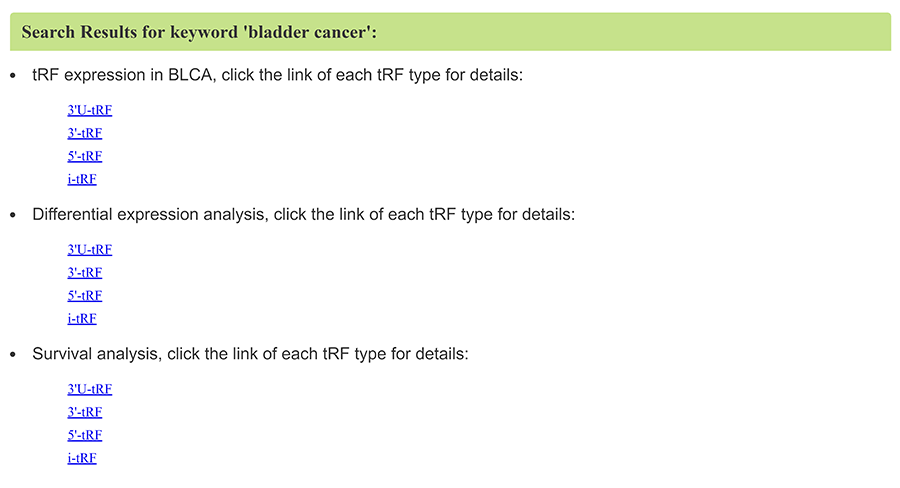
Figure 9. Keyword search for 'bladder cancer'
Gene symbol can also be searched as a keyword. For example, uses can search a gene symbol "CALD1" and OncotRF will return all related tRFs in cancers (Figure 10).
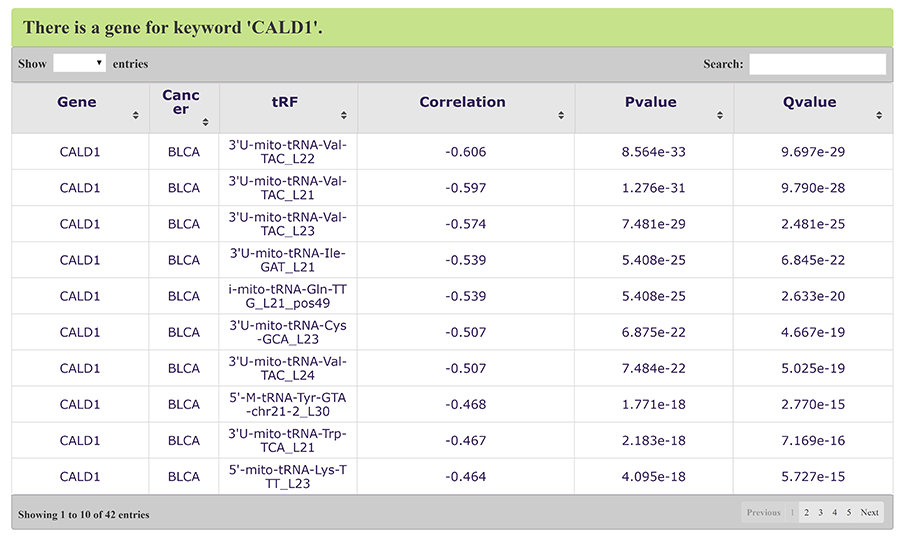
Figure 10. Keyword search for gene symbol 'CALD1'
4. Cancer
(1) Differential Expression Analysis
A key feature of OncotRF is the comprehensive display of cancer-related tRFs. The differentially expressed tRFs and mRNAs between tumor and normal tissues were calculated using R package DESeq with default parameters and filtered by the absolute value of Log2FoldChange >1 and Pvalue < 0.05 (Figure 10 a, b). The Pearson correlation coefficient was used to measure the strength of the association between the filtered tRFs and mRNAs. By default, the absolute value of correlation coefficients exceeding 0.4 (default as |r| > 0.4) will be shown. However, if the number of tRF-gene pairs was greater than 5000, the threshold of 0.6 will be used and 0.5 for number greater than 2000. In the following network and enrichment analysis, the same threshold will be used. That is to say, if the tRF-gene pairs that the absolute value of correlation coefficients exceeding 0.5 is shown in Figure 10c, then only these pairs will be shown in network and used for functional enrichment (Figure 10 d) rather than the absolute value of correlation coefficients exceeding 0.4. KOBAS 3.0 was used for identification of enriched pathways, diseases and GO terms, including KEGG PATHWAY, BioCyc, Reactome, PANTHER, OMIM, KEGG DISEASE and GO.
For thresholds of 0.5 and 0.6, addtional links (correlation, network, functional enrichment result) for threshold of 0.4 will be provided. Users can download and open with text editor.
Users can click each tRF type of each cancer type in tree navigation on the left (Figure 9).
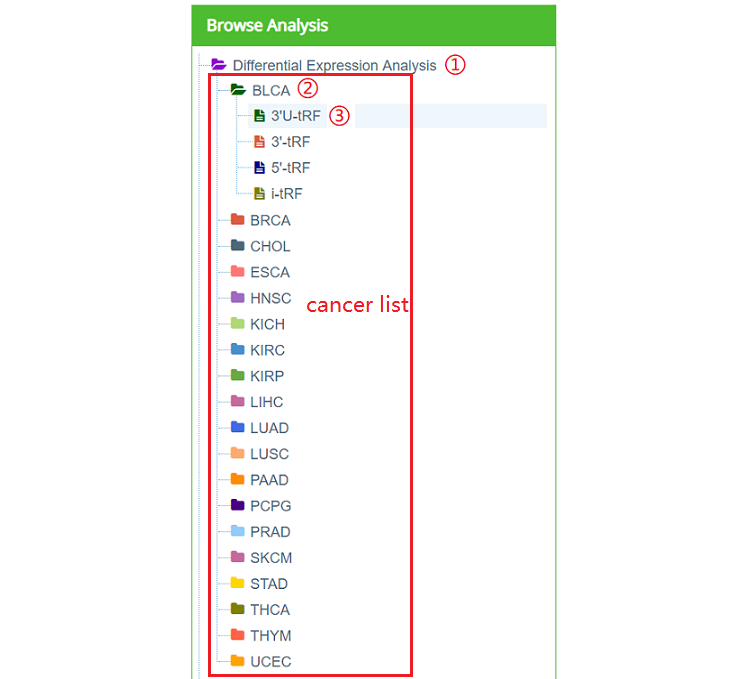
Figure 11: Navigation of "Differential Expression Analysis"
For example, users can click ①"Differential Expression Analysis", ②BLCA,③3‘U-tRF. As a result, a new page will refreshed on the right (Figure 11). This page consists of six parts: a) Differential expressed tRFs (Log2FoldChange >1 and Pvalue < 0.05); b) Differential expressed mRNAs (Log2FoldChange >1 and Pvalue < 0.05); c) Correlation analysis (default as |r| > 0.4); d) Network analysis (default as |r| > 0.4); e) Functional analysis (default as |r| > 0.4); f) Survival analysis (only the filtered tRF shown in Figure 10a).
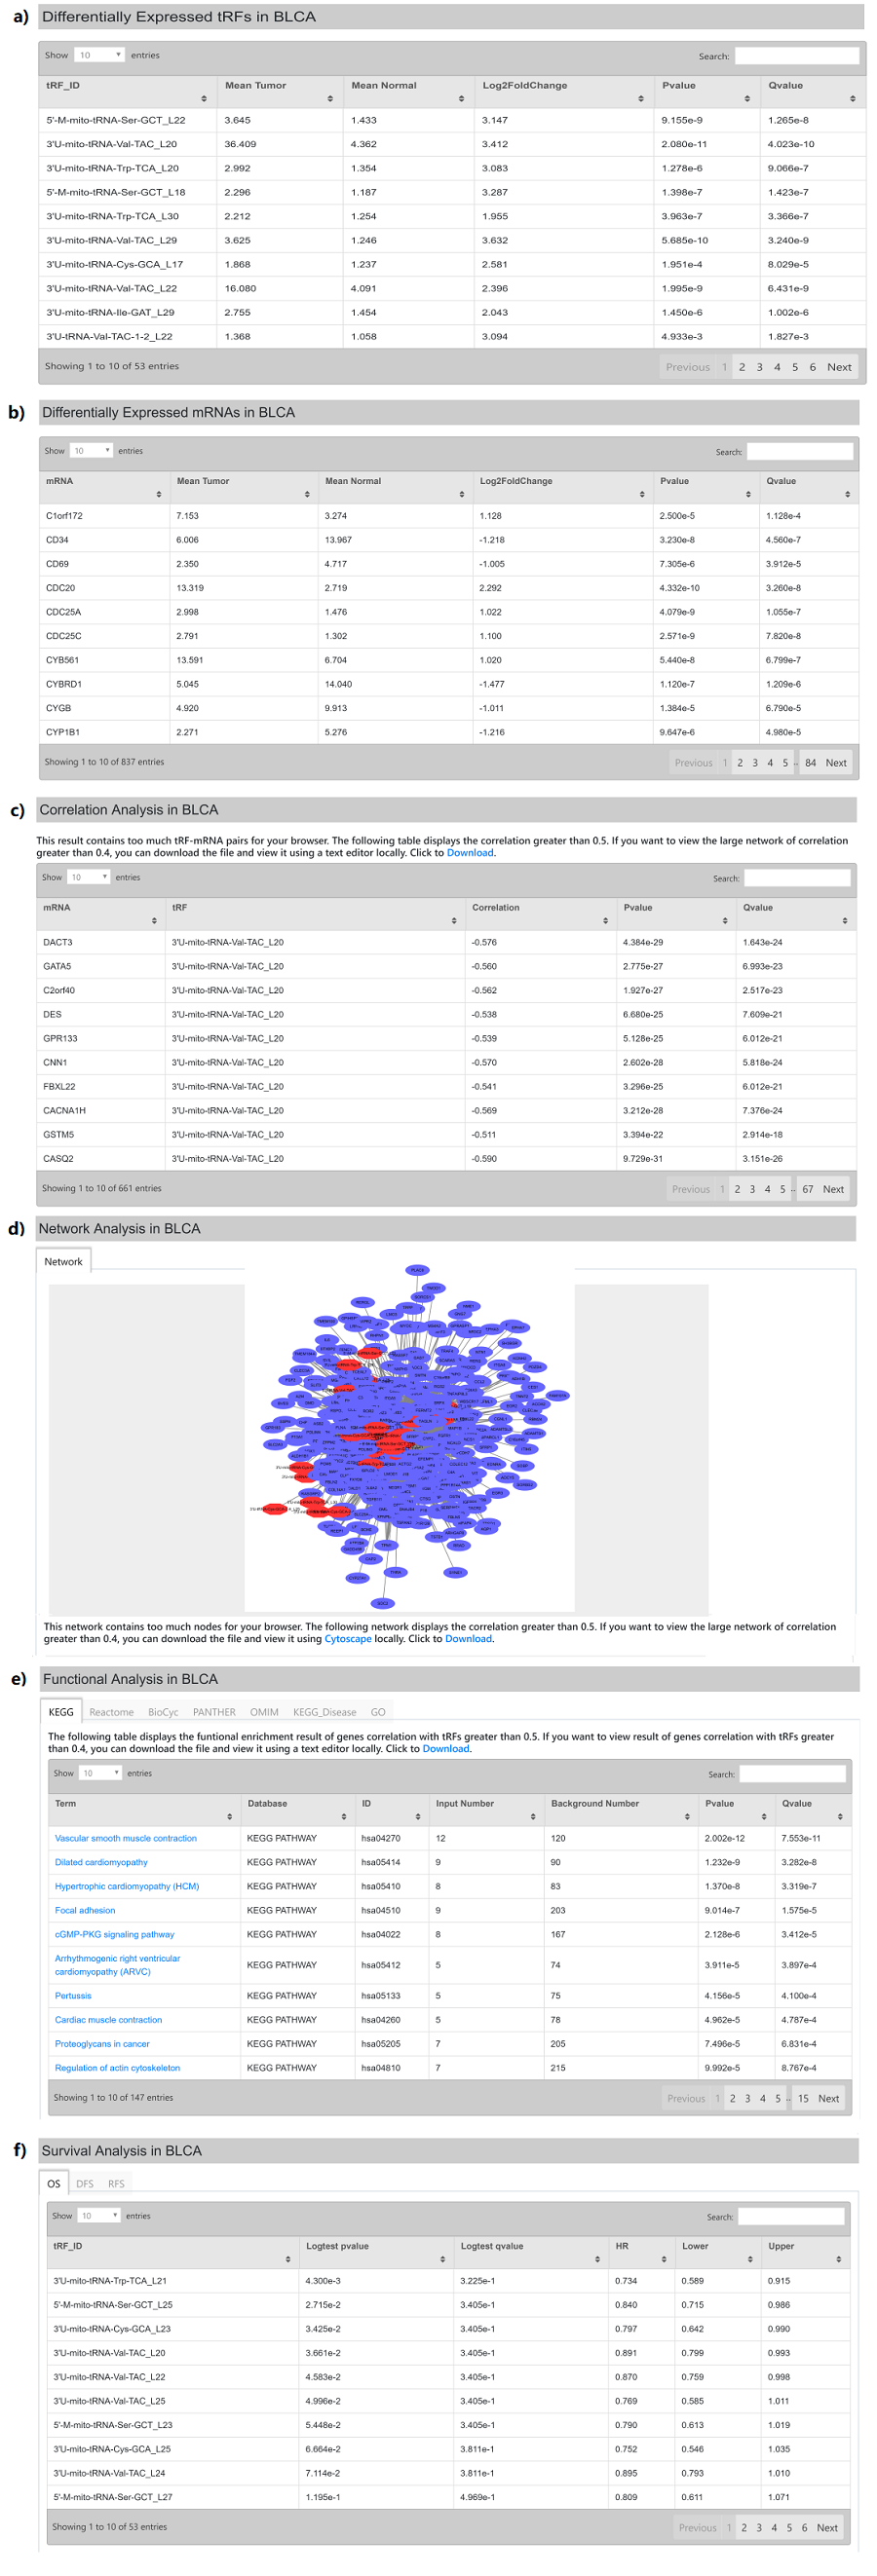
Figure 12. Differential Expression Analysis
(2) Survival Analysis
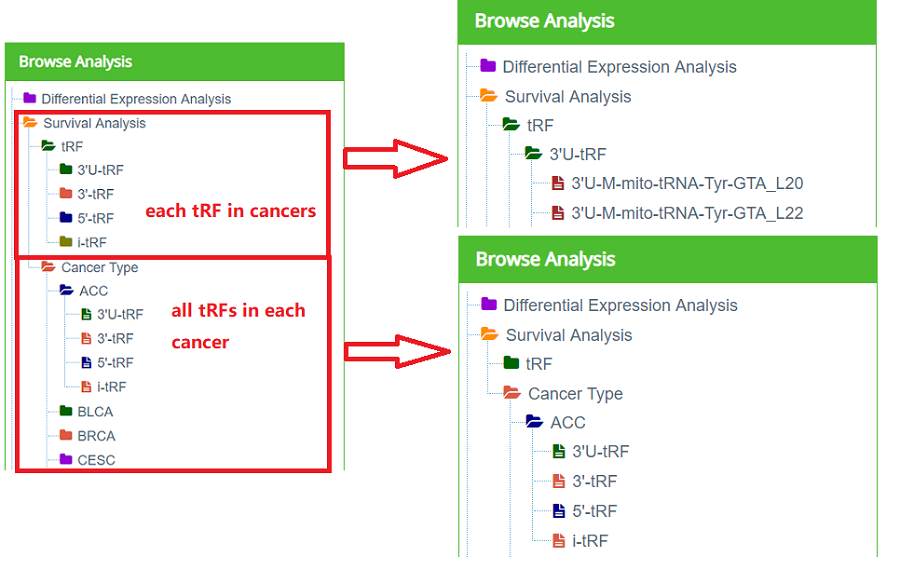
Figure 13. Survival Analysis Navigation
Survival analysis consists "each tRF in cancers" and "all tRFs in each cancer" (Figure 13). "Each tRF in cancers" consists of three tables (Overall Survival Analysis, Disease-free Survival Analysis and Relapse Free Survival Analysis) and KM survival curves of this tRF in each cancer (Figure 14). Taking "3'U-M-mito-tRNA-Tyr-GTA_L20" as an example. Click "Survival Analysis" —— "tRF" —— "3'U-tRF" —— "3'U-M-mito-tRNA-Tyr-GTA_L20", and the right part of the web page will be refreshed as Figure11.
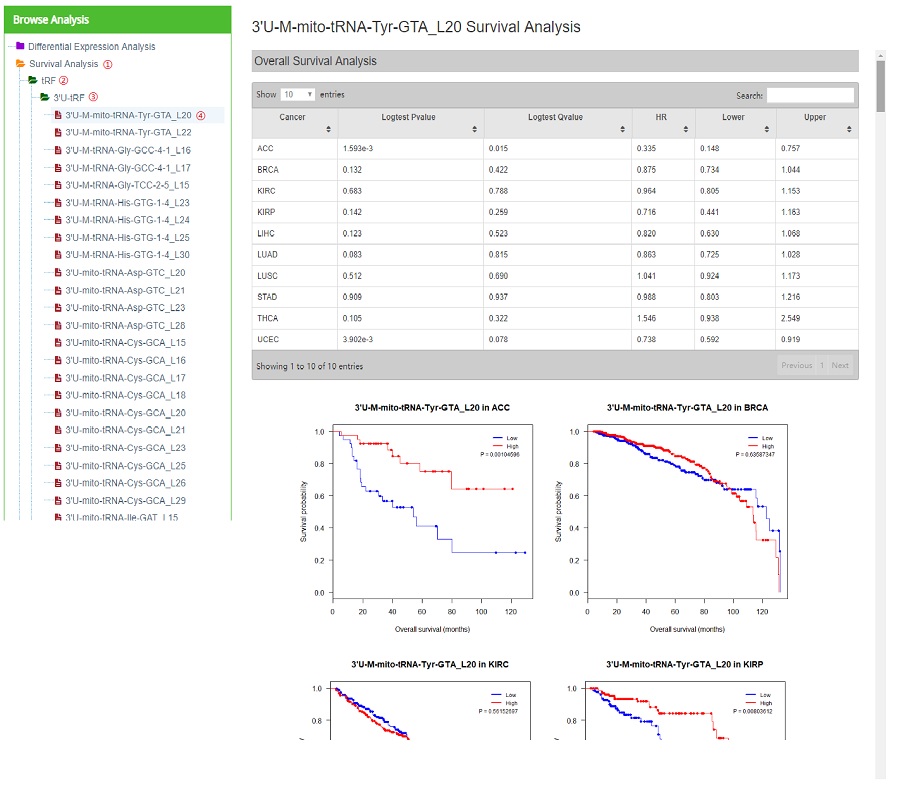
Figure 14. Survival analysis result of 3'U-M-mito-tRNA-Tyr-GTA_L20
"all tRFs in each cancer" consists of three tables (Overall Survival Analysis, Disease-free Survival Analysis and Relapse Free Survival Analysis) (Figure 15). Taking "ACC" as an example. Click "Survival Analysis"——"Cancer Type"——"ACC"——"3'U-tRF", and the right part of the web page will be refreshed as Figure15.
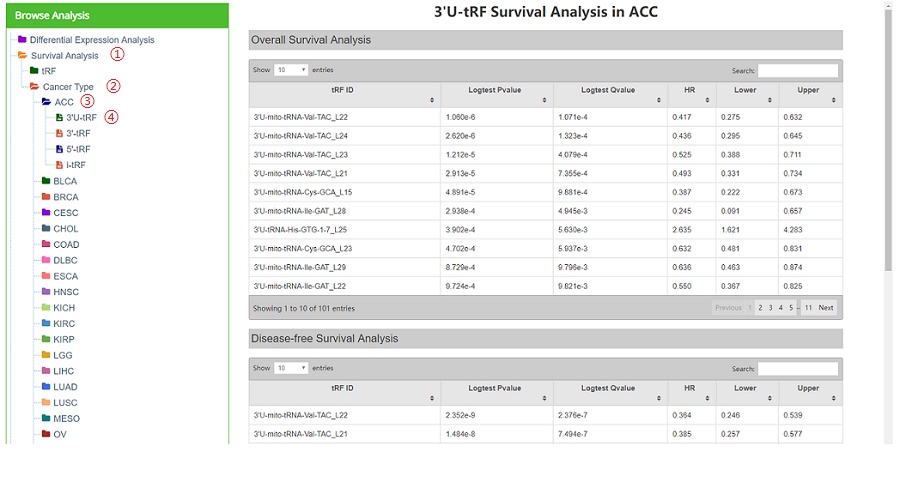
Figure 15. Survival analysis result of 3'U-tRFs in ACC
5. Custom
Another key function of OncotRF is the ability to analyze differentially expressed tRFs between two user-defined groups (Figure 16a). For example, if we want to compare the tumors between male and female in ACC, we can choose parameters like Figure 16a, and a result like Figure 16b will be shown as soon as the job is completed.

Figure 16. Custom analysis of ACC
6. KM-plotter
To discovery of prognostic biomarkers in cancers, OncotRF provides an online KM-plotter. As shown in Figure 17a, a series of parameters can be chosen, and a table of parameters and a survival curve will be shown like Figure 17b.
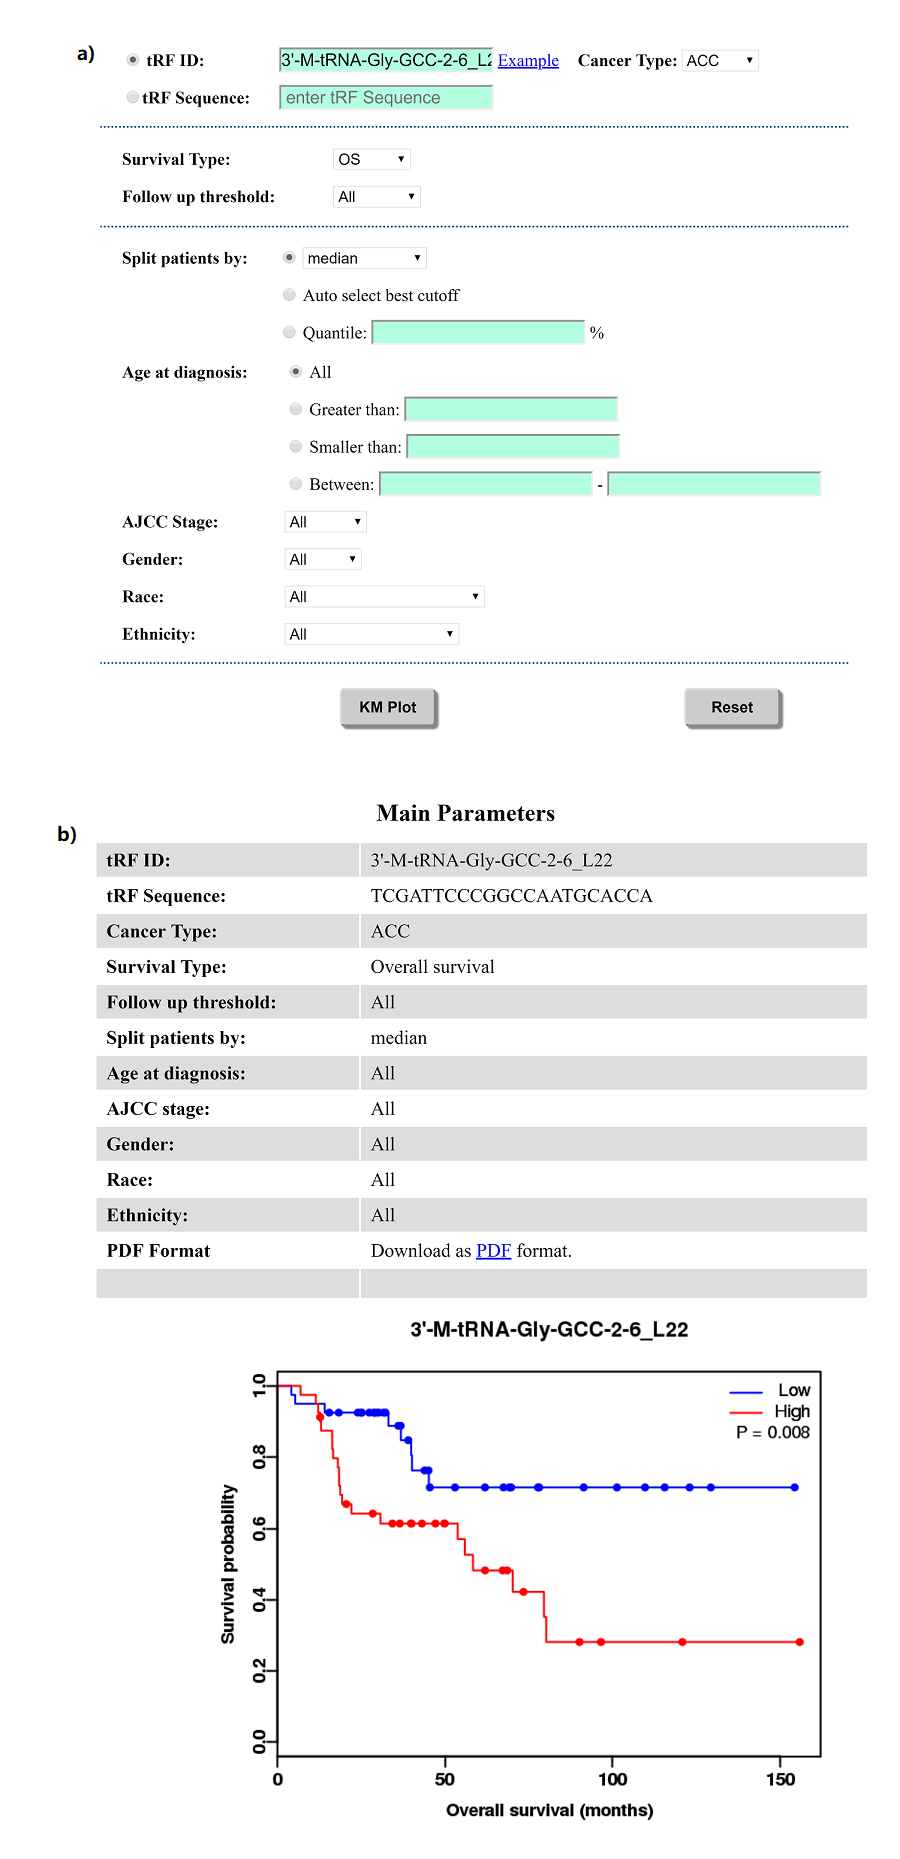
Figure 17. KM-plotter
7. JBrowse
JBrowse is a useful web-based genome browser for visualizing genomic data. It enables the users to visualize discrete features, such as tRFs, tRNAs and gene structures. With JBrowse, we can easily access the upstream and downstream flanking sequence of tRFs and details annotations for these features.
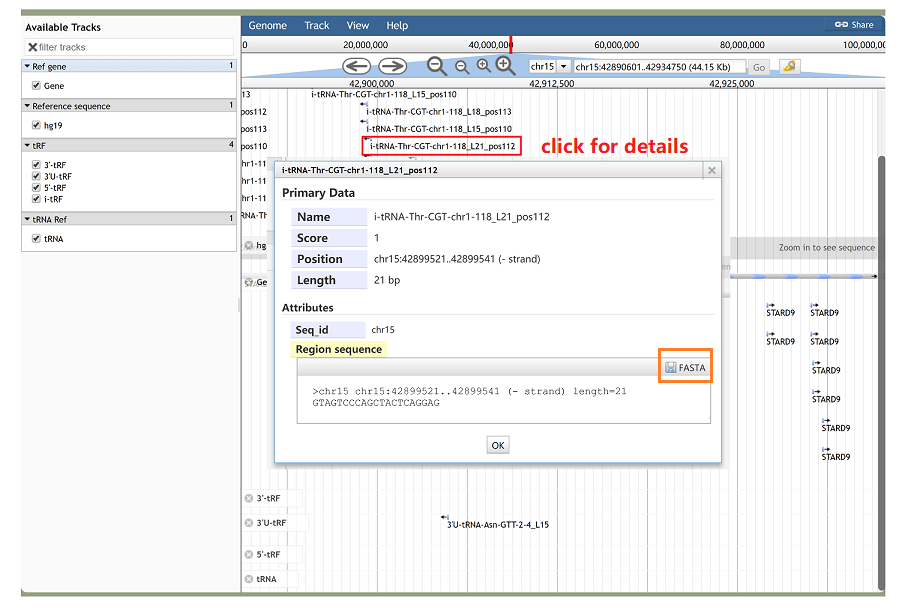
Figure 18. JBrowse
8. Help information
The "Help" page displays tutorial and information about how to use OncotRF.


